My core expertise is in measurement methodology, survey & experimental design, impact evaluation (causal inference), and advanced statistics & machine learning (supervised and unsupervised). The services I provide range from one-off data analyses to project management (from design to completion).
In addition to written reports, I employ tools that go beyond words and allow communicating data-driven insights in impactful ways. These include creative approaches to examining and presenting data (see illustrative examples, below):
In addition to written reports, I employ tools that go beyond words and allow communicating data-driven insights in impactful ways. These include creative approaches to examining and presenting data (see illustrative examples, below):
Data SonificationThis project translated data on casualties of global terror attacks in 2000 and 2001 into an orchestral piece for a 9/11 remembrance event. Data wrangling, cleaning, and transformation into a sonification-friendly format was done programmatically (implemented in R). The music was generated and touched up by the electronic artist Giorgio Volkert (implemented in Java Script). Have a listen and see if you can recognize 9/11...
|
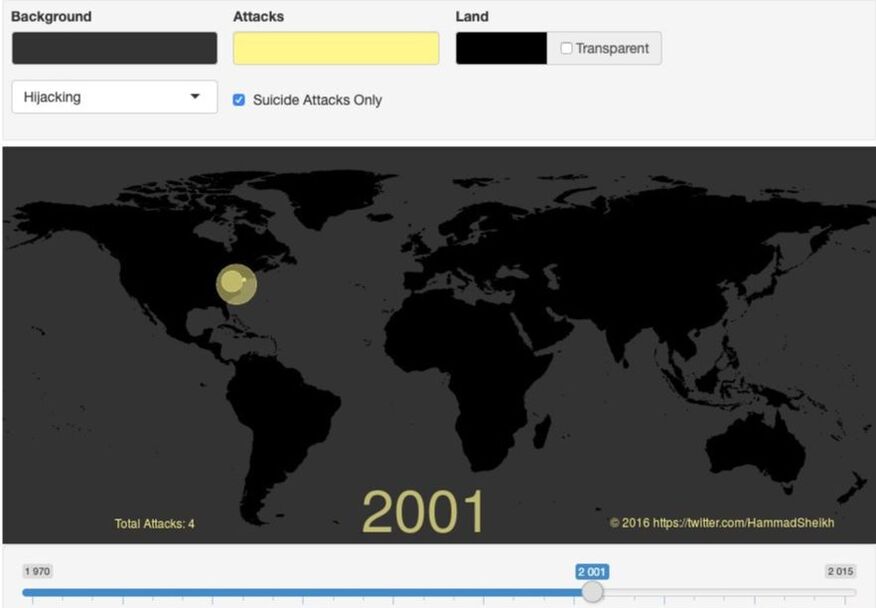
Data VisualizationThis project visualized all suicide attacks of the last 4 decades (implemented in R). See if you can spot the drastic changes in location and frequency of attacks that reflect global events (e.g., US invasion of Iraq). For a better viewing experience, watch on Twitter.
|
Web AppsAs a response to requests for alterations to my earlier visualization, I created and deployed a dashboard (implemented in R and Shiny) that allows users to quickly visualizations of the global terrorism database, according to their needs (e.g., years, type of attacks, color scheme).
|
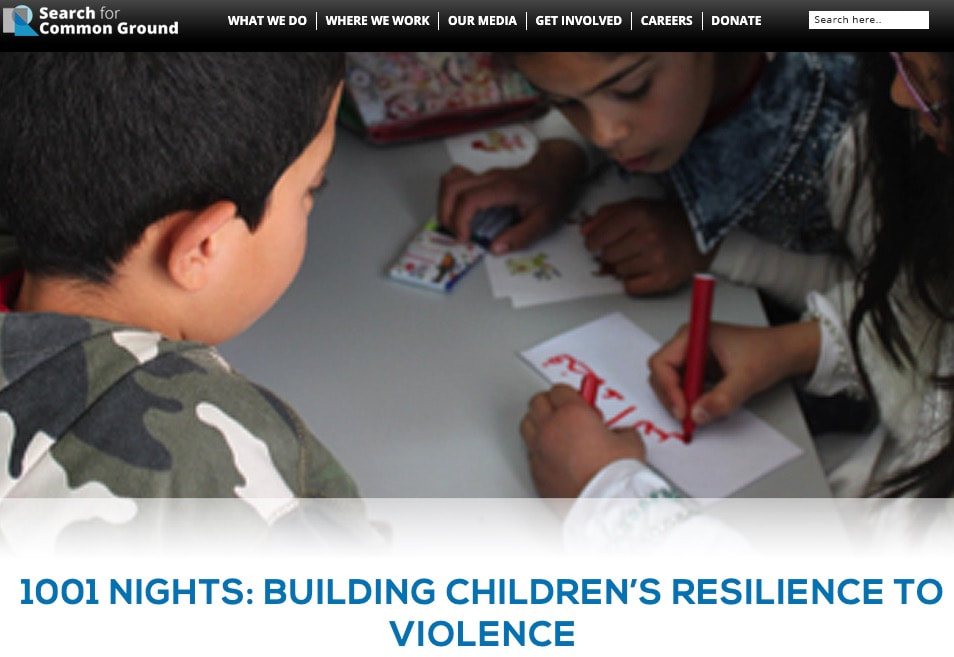
Traditional ReportsThis is an report on an international impact evaluation of educational programming that I led for Big Bad Boo Studios.
|